

Network Traffic Monitoring Solutions – Key Platforms
Network Traffic Monitoring Solutions
A variety of solutions empower network administrators to harness flow data for comprehensive traffic insights.
These platforms capture and interpret communication patterns across infrastructure, transforming raw packet streams into actionable intelligence. Deployment flexibility spans on-premises servers, cloud services, or dedicated appliances.
Key offerings include integrated SaaS monitoring systems featuring real-time traffic mapping alongside device health metrics.
Windows-compatible suites bundle flow analysis with full-stack performance tracking.
Cross-platform tools support multiple standards like NetFlow, IPFIX, and J-Flow across Windows and Linux environments.
Cloud-native services deliver scalable traffic monitoring with predictive capacity planning.
Open-source options provide cost-effective visibility through packet sampling and analysis.
Cybersecurity-focused systems correlate flow data with threat detection, available as software or hardware solutions.
Specialized traffic analyzers identify bandwidth hogs and application performance issues.
Cloud-based analytics engines process on-premises traffic data without local infrastructure.
Enterprise log management platforms extend capabilities to flow data interpretation.
Time-series database stacks incorporate flow metrics into broader observability frameworks.
Flow monitoring operates by categorizing IP traffic into distinct conversations based on endpoints, protocols, and ports. Devices cache these flow records before periodic export to collectors. This method focuses on OSI layers 3-4, providing conversation-level visibility rather than packet-level capture.
Trade-offs exist between sampling techniques: traditional flow monitoring offers granular host-level accuracy but consumes device resources, while sampled alternatives enhance scalability at the cost of full-fidelity data. Sampling occurs either in hardware (minimizing CPU impact) or software, with latency varying by export method.
Modern implementations support customizable templates and layer-2 monitoring, adapting to diverse network environments. Selection criteria emphasize multi-protocol support, threshold alerting, visual analytics, and bottleneck identification.
Evaluating solutions through free trials is recommended given the complexity of these advanced systems. Consider resource requirements, scalability needs, and investigation depth when choosing tools for growing networks.
Auvik operates as a cloud-based solution for network oversight.
Its TrafficInsights module delivers essential flow data analysis capabilities.
This component interprets diverse flow formats: NetFlow, IPFIX, J-Flow, and sFlow.
Compatibility across various vendor devices is ensured through multi-protocol support.
Real-time visibility into network behavior is a core strength.
Examine active traffic patterns and pinpoint bandwidth-consuming applications instantly.
Identify endpoints generating or receiving the most traffic through detailed logging.
Beyond flow data, the platform automatically diagrams your network topology.
Visual infrastructure maps emerge without manual configuration.
Deployment involves installing an on-site collector via a guided process.
The system continuously inventories devices and monitors their status.
TrafficInsights layers flow analysis atop this foundational monitoring.
Its design specifically accommodates complex, multi-vendor network environments effectively.
NetFlow visibility is exclusively available in Auvik's premium subscription tier through their TrafficInsights feature. This cloud-based monitoring solution delivers real-time network traffic analytics, highlighting key metrics such as highest bandwidth consumers and protocol distribution across your infrastructure.
One particularly useful visualization maps global traffic patterns, displaying geographical sources and destinations of external network communications on a world map interface.
For more detailed investigation, administrators can perform custom traffic analysis by directly accessing and manipulating flow records within the Auvik console. This functionality supports advanced filtering, sorting, and grouping capabilities that help identify traffic patterns and anomalies. Each record provides comprehensive source and destination information, enabling precise traffic tracking and troubleshooting.
Auvik TrafficInsights dominates as the premier NetFlow solution, purpose-built for network administrators seeking granular traffic analysis.
Its cloud-based architecture eliminates on-premise complexity while offering protocol flexibility for multi-vendor environments.
Key strengths include live session monitoring, traffic source mapping, and bandwidth consumption insights across applications, users, and devices.
The Performance plan unlocks critical features like comprehensive flow data analysis (NetFlow/sFlow), though this tier may challenge smaller budgets.
Notably, pricing follows a site-based model without per-device fees - ideal for large-scale deployments.
Additional perks include a cross-platform log manager with manual analysis capabilities and a 14-day trial period.
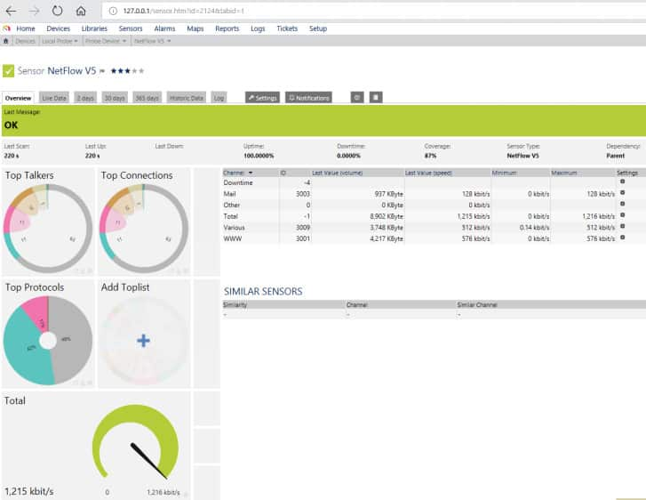
Separately, Paessler PRTG delivers all-inclusive monitoring covering bandwidth, device health, and multi-site infrastructure.
Its sensor-based model provides 100 free sensors post-trial, with each device typically consuming multiple data streams.
This approach particularly benefits smaller networks needing immediate visibility without upfront investment.
The platform extends coverage to WAN, VPN, and cloud services through its consolidated dashboard interface.
Both solutions exemplify robust flow analysis, albeit through distinct deployment and pricing philosophies.
Within PRTG’s interface, the central element is the device hierarchy, which visually maps out all network components such as routers, switches, firewalls, servers, and endpoints like workstations and virtual machines. This structure is complemented by detailed tables displaying sensor data, logs, and alerts, alongside various visualizations like charts and graphs illustrating bandwidth usage and performance metrics. Users can easily sort and filter these tables for targeted analysis.
Key capabilities include:
- Wide-ranging sensor integrations: enabling precise traffic and device monitoring through diverse sensor types tailored to specific network elements.
- Unified performance oversight: allowing comprehensive tracking of infrastructure, network health, and application performance within a single platform.
- Customizable alerting: offering flexible notification settings, including thresholds, to promptly inform administrators of potential issues.
PRTG Network Monitor is a versatile solution equipped with multiple sensor options for traffic analysis, including protocols like NetFlow, sFlow, J-Flow, IPFIX, and packet sniffers. It supports wireless network monitoring and incorporates a ping tool for connectivity tests. The platform also features SNMP monitoring for device health checks and an auto-discovery feature that maps out network topology and inventories devices automatically. Extending beyond network metrics, PRTG can also monitor servers and applications, delivering an all-encompassing monitoring environment.
Navigating through the device tree reveals detailed statistics and performance indicators at every level. Configuration settings such as scan intervals can be inherited or customized at specific nodes. Alerts can be configured individually or aggregated across the network, with notification options including email and SMS, ensuring critical events are promptly addressed.
The device and sensor architecture influences the design of dashboards and reports. Users can craft personalized dashboards, including interactive maps, and utilize a variety of predefined or custom reports, which can be scheduled for regular delivery. This flexibility ensures tailored insights into network performance and health.
Many network analysis solutions incorporate native support for NetFlow, enhancing traffic monitoring capabilities. For example, PRTG Network Monitor offers compatibility with multiple flow protocols, including NetFlow, sFlow, and J-Flow, alongside other data collection methods such as SNMP, WMI, and packet sniffing. Paessler refers to these detection mechanisms, including the NetFlow collector, as "sensors," which are essential for comprehensive network insight.
Setting up PRTG is designed to be user-friendly, featuring an guided wizard and instructional videos that walk users through the process step-by-step. During installation, the core server performs automatic device discovery via its local probe, configuring sensors automatically. Additional sensors, including custom NetFlow collectors, can be added manually with ease, supported by detailed tutorials.
The core server component operates exclusively on Windows, limiting deployment options to this platform. Monitoring a single site is straightforward through the web interface, but managing multiple core servers simultaneously requires the Windows-based enterprise application. PRTG also offers a dedicated mobile app, which facilitates remote monitoring. A notable feature is the use of QR codes—these can be affixed to devices, enabling quick device status checks via the mobile app.
For fault tolerance, PRTG supports clustering, allowing administrators to set up failover servers to ensure continuous operation. This system can be deployed on Windows Server environments, placing it among competitors like SolarWinds and ManageEngine. Additionally, PRTG is available as a SaaS solution, competing with cloud-based platforms such as Site24x7.
A significant advantage for smaller organizations is PRTG’s free version, which permits up to 100 sensors without any cost. This makes it accessible for small businesses or limited environments, providing a comprehensive monitoring solution without financial commitment.
PRTG offers an integrated approach, covering various monitoring needs from network traffic analysis to application performance. It optimizes data collection by capturing only packet headers, which enhances processing speed and reduces storage requirements. The platform features intuitive visualizations, such as clear graphs, enabling straightforward traffic analysis.
Sensor licensing is based on the number of sensors used, which can impact costs as your network expands. Organizations should consider long-term planning regarding sensor needs and licensing expenses. A 30-day free trial is available for evaluation, allowing users to explore the full capabilities before committing.
To learn more or try PRTG Network Monitor, you can download the free trial from the official website.
Another tool worth mentioning is Progress WhatsUp Gold, an on-premises network monitoring package. Its base version provides essential device monitoring, with advanced editions including additional features like NetFlow collection via Flowmon. In the higher-tier plans, Flowmon acts as a dedicated NetFlow collector, feeding traffic data into analysis modules for detailed traffic insights.
Related content includes comprehensive evaluations of Juniper Networks' J-Flow monitoring tools, providing further options for flow analysis across different network environments.
NetFlow Analysis Excellence: Comprehensive Monitoring Solutions
A standout feature of top-tier NetFlow analyzers is their protocol versatility. Premium solutions support diverse flow technologies including NetFlow, IPFIX, J-Flow, sFlow, and NetStream. This multi-protocol capability ensures compatibility across heterogeneous networking environments.
Effective network monitoring tools excel at vendor-agnostic operation, seamlessly communicating with equipment from various manufacturers simultaneously. This eliminates blind spots in networks built with diverse infrastructure components.
Advanced traffic analysis platforms incorporate sophisticated alerting mechanisms that notify administrators of potential performance issues before they impact users. These proactive notifications are essential for maintaining optimal network operations.
WhatsUp Gold represents an integrated approach to network management, combining traffic analysis with device status monitoring in a unified platform. This solution automatically discovers and documents network topology while continuously tracking traffic patterns across all connections.
The pre-configured threshold alerts in WhatsUp Gold enable quick identification of capacity constraints and performance bottlenecks. This immediate visibility helps technical teams address emerging issues promptly.
The synergy between WhatsUp Gold's traffic analysis capabilities and its core device monitoring functionality creates a powerful troubleshooting environment. Since network congestion often stems from hardware limitations or failures, having both perspectives in a single console streamlines the diagnostic process.
When traffic anomalies occur, network engineers can immediately correlate flow data with the operational status of relevant infrastructure components, significantly reducing mean time to resolution for complex networking problems.
The WhatsUp Gold suite begins its network management process by automatically discovering all connected devices, creating a comprehensive dashboard for administrators. This initial scan ensures that the system accurately documents device details and network topology, facilitating seamless communication with switches and routers through the Flowmon component. Continuous re-scanning guarantees that the dashboard remains up-to-date, reflecting any network changes.
Its alerting capabilities are enhanced with pre-configured threshold settings, allowing users to receive notifications when network activity exceeds certain limits. These thresholds are customizable, and users can define additional specific alert conditions tailored to their unique operational requirements, ensuring proactive network monitoring.
This module is designed for larger-scale networks, supporting environments with 1,000 to 25,000 connected devices. It is integrated into the full WhatsUp Gold package, which includes multiple modules providing comprehensive network oversight. Note that this feature is not available as a standalone product and isn't offered in the most affordable editions, emphasizing its enterprise focus.
Key features include integration with network device monitoring, delivering real-time device status alongside traffic data, and an automated setup process that eliminates the need for manual device configuration. Additionally, the package offers a visual network topology map, aiding in network visualization and troubleshooting. It is deployed on Windows Server environments and does not support a cloud-based version.
Progress offers four editions of WhatsUp Gold—Business, Enterprise, Enterprise Plus, and Enterprise Scale—with the network traffic monitoring and Flowmon collector included starting from the Enterprise Plus or Enterprise Scale editions. A free 14-day trial is available for evaluation.
Meanwhile, ManageEngine's NetFlow Analyzer delivers instant insights into network bandwidth consumption and traffic trends. It provides detailed visualizations categorized by applications, protocols, and conversations. Users can set alert thresholds for immediate notification of abnormal traffic levels. The tool also features a suite of predefined reports suitable for troubleshooting, capacity planning, and billing purposes, with options to create customized reports for specific analysis needs.
A comprehensive network management solution, the NetFlow analyzer incorporates a suite of specialized tools designed to facilitate detailed traffic monitoring and analysis. Its web-based dashboard offers a user-friendly interface featuring dynamic visualizations, including pie charts and heat maps that display real-time data on interface health, application usage, protocol distribution, active conversations, recent alerts, and quality of service metrics.
Key capabilities include:
- Instantaneous traffic insights: enabling administrators to observe bandwidth consumption and traffic trends as they happen.
- Cross-location surveillance: supporting the monitoring of multiple sites to ensure network-wide visibility.
- VoIP traffic prioritization: optimized to handle latency-sensitive protocols like VoIP with dedicated analysis features.
The tool functions as an independent software package capable of analyzing traffic data collected via various protocols such as NetFlow, IPFIX, sFlow, J-Flow, NetStream, and AppFlow. It proficiently gathers statistics from a broad range of network hardware devices from leading manufacturers. Additionally, it extends its monitoring scope to wireless networks and supports multi-site configurations, including the management of Internet connections between locations.
Advanced features include traffic shaping capabilities through mechanisms like Class-Based Quality of Service (CBQoS) and IP Service Level Agreements (SLAs) for evaluating time-critical traffic. Interactive elements, such as hover-over explanations and clickable graphics, facilitate deep dives into specific data points, while dedicated dashboards assist in pinpointing security threats. Customization options allow users to tailor the interface to their specific network monitoring needs.
Network alerts are prominently displayed as pop-up notifications within the user interface, ensuring immediate visibility. The platform supports comprehensive analysis of traffic across multiple sites, facilitating broad network oversight. For mobile users, a dedicated smartphone application is available, enabling on-the-go monitoring and alert management.
Supported flow collection protocols include NetFlow, IPFIX, J-Flow, NetStream, among others, allowing compatibility with diverse network devices. The system utilizes advanced capabilities of Cisco hardware, such as dynamic traffic shaping and Quality of Service (QoS) policy adjustments, to optimize network performance.
Designed primarily for medium to large organizations, this solution offers a free edition tailored for small businesses. However, the free version limits monitoring to only two interfaces, which may be insufficient for larger or more complex environments, rendering it less suitable for small-scale setups. In comparison to leading competitors like SolarWinds NetFlow Traffic Analyzer, ManageEngine’s offering stands out as a standalone product that installs directly on Windows Server. Unlike SolarWinds, which requires integration with their Network Performance Monitor, ManageEngine’s tool is compatible with Linux and can be deployed as a cloud service via AWS.
Key features include:
- Versatile protocol support for diverse network architectures.
- Scalability to accommodate expanding enterprise networks.
- In-depth traffic analysis providing detailed insights for effective network management.
- Limited suitability for small networks due to interface restrictions.
- Potential complexity for users lacking technical expertise, necessitating some learning curve.
ManageEngine’s NetFlow Analyzer excels in managing complex, large-scale networks with extensive use of flow data. The free trial offers unlimited monitoring for 30 days, after which the service reverts to monitoring only two interfaces. The platform is part of a broader suite of network management tools, allowing integration beyond traffic analysis to comprehensive network oversight. Users are encouraged to download the trial for evaluation.
Meanwhile, Site24x7 provides a cloud-based network traffic monitoring solution integrated into a broader system management platform. It encompasses infrastructure oversight, website management, application performance monitoring, and services tailored for managed service providers. The tool offers real-time traffic tracking along with historical data storage for capacity planning and trend analysis. Accessible via any standard web browser, the dashboard relies on server-side processing, with an agent installed locally to facilitate data collection and monitoring.
Network Flow Analysis Technologies
Comprehensive Network Flow Analysis Solutions
Network flow analysis tools have become essential components in modern network management strategies. These solutions offer deep visibility into traffic patterns, enabling administrators to optimize performance and enhance security.
Multi-Protocol Compatibility
Today's leading flow analysis platforms support an impressive array of collection protocols beyond just NetFlow. Administrators can leverage IPFIX, sFlow, J-Flow, NetStream, and other vendor-specific formats to gather comprehensive traffic data. This cross-protocol compatibility ensures organizations can implement consistent monitoring regardless of their network infrastructure components.
Advanced Traffic Intelligence
Modern flow analyzers go far beyond basic bandwidth monitoring. They provide granular insights into application usage, user activities, and communication patterns. By examining traffic flows, these systems can categorize data by:
- Application type and usage patterns
- Source and destination endpoints
- User account activities
- Protocol distribution
Security Through Anomaly Recognition
One of the most valuable capabilities in contemporary flow analysis tools is anomaly detection. By establishing baseline traffic patterns, these systems can quickly identify deviations that might indicate security threats or network problems. This proactive approach helps organizations address potential issues before they impact operations.
Resource Optimization Benefits
Flow analysis provides crucial data for capacity planning and resource allocation. Time-series visualization helps identify usage trends, peak periods, and underutilized resources. With this intelligence, IT teams can:
- Schedule bandwidth-intensive tasks during off-peak hours
- Prioritize critical application traffic
- Make informed infrastructure upgrade decisions
- Justify IT expenditures with detailed usage reports
Deployment Options
Organizations can choose between on-premises deployments, cloud-hosted solutions, or Software-as-a-Service models depending on their specific requirements. Cloud-based options provide flexibility and scalability, while SaaS offerings reduce maintenance overhead by eliminating the need for internal infrastructure management.
Enterprise Integration
The most effective flow analysis tools integrate seamlessly with broader IT monitoring ecosystems. This integration creates a unified view of network performance, server health, and application behavior, enabling more effective troubleshooting and optimization efforts.
Network Monitoring Solutions: Enhancing Visibility and Performance Management
Network monitoring systems provide comprehensive traffic visualization capabilities, allowing administrators to observe data flow patterns across individual links and complete network paths. These tools are invaluable for identifying congestion points and implementing effective traffic management strategies including queue management and priority-based routing.
Alert mechanisms form a critical component of these systems, with customizable performance thresholds established to provide adequate response time for remediation. When metrics exceed these predefined limits, the system generates notifications through multiple channels including dashboard displays, email notifications, SMS alerts, and voice communications to ensure timely intervention.
Key Advantages of Modern Traffic Analysis Platforms
The latest generation of NetFlow analysis tools features exceptionally intuitive control panels that simplify complex data interpretation. Many solutions now extend monitoring capabilities to mobile devices with dedicated applications for major platforms, enabling management flexibility regardless of location.
Device compatibility represents another significant strength, with leading solutions supporting equipment from numerous manufacturers to accommodate diverse network environments.
Potential Challenges to Consider
Despite their advantages, comprehensive monitoring platforms may present certain challenges:
The extensive functionality offered by advanced systems can sometimes create complexity that requires dedicated effort to navigate effectively.
Organizations should anticipate allocating sufficient training resources, as maximizing the value of sophisticated customization options typically requires an investment in skill development.
Pricing Structure and Package Options
Traffic monitoring capabilities are typically included within broader service packages:
Website performance monitoring packages begin at $9 monthly and include basic traffic analysis features.
Infrastructure-focused plans also start from $9 per month with network-centric monitoring tools.
More comprehensive application performance monitoring solutions, starting at $35 monthly, incorporate advanced traffic analysis alongside application metrics.
Organizations seeking consolidated monitoring can opt for comprehensive packages that combine all monitoring services including traffic analysis, with entry-level options beginning at $35 monthly. Managed service providers can access specialized multi-tenant versions starting from $45 per month.
All subscription options include a complimentary 30-day evaluation period to assess suitability before commitment.
Open-Source Alternatives
For organizations considering open-source solutions, ntopng provides web-accessible traffic analysis through passive monitoring techniques, analyzing both flow data and statistical information from observed network activity. This platform conducts packet capture independently but relies on nprobe for NetFlow/IPFIX collection functionality, supporting multiple flow protocols including NetFlow v9.
While the community edition of ntopng is available without cost, professional and enterprise capabilities require licensing, though educational and nonprofit organizations qualify for free access. Similarly, nprobe offers limited free testing functionality, but full capabilities require purchasing appropriate licensing unless qualifying for exemption.
Essential Features of NProbe and NtopNG
Versatile Open-Source Solution
The software delivers exceptional customization through its open-source architecture, allowing organizations to tailor monitoring capabilities to their specific needs.
Protocol Flexibility
With comprehensive support for multiple flow protocols, the system offers remarkable versatility for various network environments and monitoring requirements.
Universal System Compatibility
Designed to function across Windows, Linux, macOS, and Unix platforms, ensuring seamless deployment regardless of your organization's infrastructure preferences.
Operational Overview
NProbe and NtopNG function as complementary components rather than standalone tools. NProbe serves as the packet collection engine, capturing raw network data and feeding it to NtopNG for comprehensive analysis. This architecture provides exceptional monitoring capabilities that extend beyond basic traffic analysis.
The platform excels in collecting SNMP data for comprehensive device health monitoring and offers protocol-specific packet analysis. Security teams particularly value its anomaly-detection capabilities for identifying potential network intrusions.
Interface and Visualization
The web interface organizes information into logical categories including traffic patterns, flow analysis, host details, device statistics, and interface performance. Each section offers multiple visualization options through interactive charts, detailed tables, and informative graphs.
Users can drill down into specific metrics for deeper investigation and cross-reference data points across different views. The customizable table sorting functionality allows for quick identification of network issues - for example, quickly identifying bandwidth-intensive applications by sorting the flows table by throughput.
Plixer Scrutinizer emerges as a specialized security-focused NetFlow and sFlow analysis platform
featuring forensic incident response capabilities
Deployment flexibility spans physical appliances, virtual machines, and cloud-based SaaS models
Resource-intensive implementation demands substantial allocation (minimum 16GB RAM)
even for evaluating its comprehensive free trial version
ntopng delivers real-time protocol visibility including social media and streaming applications
Geolocation mapping pinpoints host origins while granular alerts trigger visual notifications
Performance metrics cover latency measurements and TCP packet loss diagnostics
The professional tier unlocks historical application tracking and SNMP-based active monitoring
Customizable reporting complements its open-source extensibility framework
Cross-platform compatibility supports Windows, Linux, macOS and Unix environments
Data export options integrate with MySQL, Elasticsearch, and Logstash ecosystems
Windows installation bundles WinPcap for packet capture functionality
via straightforward setup wizards packaged in ZIP distributions
Smaller organizations benefit from cost-free licensing tiers
particularly educational and non-profit entities
though limited capabilities persist in unpaid editions
Technical complexity presents implementation hurdles
demanding significant learning investment for effective operation
Security monitoring extends to anomaly and intrusion detection
yet enterprise-scale automation remains constrained
compared to premium commercial alternatives
This tool offers a versatile approach to network management by integrating both performance oversight and security investigation capabilities. It is adaptable to various organizational needs, functioning seamlessly as a cloud-based service, an on-premises solution, or a virtual appliance. Designed to grow with your network, it efficiently supports environments from small offices to extensive enterprise infrastructures.
Primarily focused on security surveillance, the system excels at rapid detection of suspicious traffic patterns, such as intrusion attempts or denial-of-service attacks. It functions as a protocol analyzer and conducts detailed profiling of traffic source devices, enabling administrators to trace the origins of abnormal network activity or congestion points. Its intuitive dashboards display data in multiple formats simultaneously, facilitating quick identification and response to network issues by technical teams.
Designed to accommodate networks of various sizes, scrutinizer scales efficiently from small setups to extensive enterprise environments, offering comprehensive analysis and reporting capabilities.
Prospective users can try the software free for a month, gaining full access during this period. Post-trial, the free edition limits data collection to 10,000 flows per second, retains raw flow data for five hours, and maintains one week of historical summaries.
The premium version enhances the experience with features such as real-time notifications, customizable dashboards, tailored report generation, scheduled email summaries, and dedicated support services.
While scrutinizer emphasizes security monitoring, it is not primarily focused on traffic analysis, and thus may not be suitable solely for network performance tracking. Its functionalities exceed what small businesses typically require, aiming instead to assist network administrators managing vast, complex systems where manual oversight becomes impractical.
The platform can be deployed on-site as a virtual appliance or via cloud infrastructure, though it does not offer a Software-as-a-Service (SaaS) option.
Key features include flexible deployment options tailored to organizational needs, advanced security-focused traffic analysis tools, and suitability for large-scale networks. However, it requires substantial system resources and presents a steeper learning curve due to its extensive feature set.
Pricing models are not openly listed; interested parties must contact sales directly for detailed costs, which vary based on deployment platform and the number of flow exporters supported.
In contrast, SolarWinds NetFlow Traffic Analyzer (NTA) is a robust bandwidth monitoring tool capable of analyzing not only Cisco NetFlow but also various vendor-specific versions and sFlow, a common alternative.
Once set up, NTA provides a broad suite of functionalities, including bandwidth management, traffic and performance analysis, alerting systems, customizable reporting, and policy optimization, making it well-suited for managing multi-vendor network environments.
The SolarWinds Network Traffic Analyzer is designed to collect detailed flow data from devices that support flow export protocols. It seamlessly integrates with a wide range of network hardware by supporting multiple protocols such as NetFlow, sFlow, J-Flow, IPFIX, and NetStream, ensuring comprehensive coverage across diverse environments.
Users can benefit from highly customizable dashboards, allowing tailored visualization of traffic patterns and network metrics to suit specific monitoring needs. The tool provides robust capabilities in tracking Quality of Service (QoS), helping administrators prioritize critical traffic and optimize bandwidth allocation effectively.
This analyzer delivers extensive traffic analysis, including categorization by applications through NBAR2, enabling visibility into bandwidth-consuming services. It also offers performance assessments for wireless networks and virtualized environments like VMware vSphere. When paired with SolarWinds Network Performance Monitor, it enhances network management through device discovery, topology mapping, and real-time status updates.
Additionally, the software features advanced utilities such as NetPath, which facilitates detailed path analysis between endpoints, helping identify bottlenecks and troubleshoot network routes efficiently. Overall, this solution provides a comprehensive approach to network traffic monitoring and analysis across multiple protocols and device types.
The standard NetFlow traffic analysis report is organized into various categories, including the leading five applications, the five most active endpoints, the top five communication pairs, and the ten sources with the highest percentage of network usage, among others.
NetFlow analysis tools are essential for monitoring and optimizing network performance by identifying high-bandwidth users, applications, and protocols. These tools allow administrators to analyze traffic patterns over various timeframes, from minutes to months, providing valuable insights into usage trends.
Many advanced analyzers support multiple protocols beyond standard NetFlow, including Juniper’s j-flow and Huawei’s netstream, ensuring broad compatibility across different hardware vendors. They can also assess wireless network performance and virtualized environments such as VMware vSphere, offering comprehensive visibility.
With these tools, administrators can enforce traffic shaping policies, enhancing network efficiency without sacrificing service quality. Automated monitoring features combined with manual analysis capabilities make it easier to pinpoint critical traffic flows. Once identified, traffic prioritization can be implemented using Class-Based Quality of Service (CBQoS) measures, particularly beneficial for large, complex network infrastructures. This approach maximizes existing resources and reduces the need for costly hardware upgrades.
User interfaces of top analyzers typically feature clean, intuitive dashboards that simplify navigation and data interpretation. They support a wide range of network technologies, making them versatile solutions for diverse environments. Efficient data categorization enables quick insights into network activity, facilitating proactive management.
However, some tools may be too sophisticated for small-scale networks or home setups, and while many are compatible with Windows and Linux, additional configuration might be necessary for non-Windows systems.
For organizations with NetFlow-enabled devices, exploring tools like SolarWinds’ NetFlow Traffic Analyzer can be particularly beneficial. These solutions often offer free trial periods to evaluate their capabilities firsthand.
Similarly, Noction Flow Analyzer provides strategic options for network managers, focusing on bandwidth utilization, capacity planning, and performance issue detection. Its user-friendly interface includes customizable themes and a detailed data explorer that displays traffic metrics through graphs and reports. Features such as grouping, filtering, and device-specific views allow administrators to drill down into traffic details—filtering by protocols, IP addresses, ports, VLANs, MAC addresses, MPLS labels, and more. Saved queries can be added as widgets to personalized dashboards, enhancing ongoing network oversight.
Network Monitoring Tools Overview
In NFA, users can create several dashboards, each consisting of a variety of visual graphs. These dashboards are often organized around particular goals, such as capacity planning. They allow you to monitor traffic trends and identify recurring patterns, helping you determine the most suitable capacity management approach.
Noction Flow Analyzer transforms raw NetFlow data into actionable network intelligence'
delivering continuous surveillance of internal and external traffic flows'
Its visually rich console presents live statistics through dynamic charts and graphs'
Essential capabilities include granular traffic path mapping for routing optimization'
flexible querying to dissect network segments or individual nodes'
and continuous surveillance for immediate anomaly detection'
The system also supports deep historical analysis for forecasting bandwidth needs'
Alerts activate when user-defined thresholds on any metric are breached'
Notifications reach teams via email or Slack'
freeing staff from constant monitoring until intervention is required'
Deployment requires a dedicated Linux environment (Ubuntu/CentOS/RHEL)'
accessed universally through any standard web browser'
An optional add-on enriches data with Border Gateway Protocol insights'
A free trial offers initial evaluation'
Subscription pricing operates on flexible terms (monthly or annual)'
enabling unlimited network scale monitoring under one license'
This model appeals strongly to large enterprises managing multiple sites'
though may deter smaller organizations with budget constraints'
On-premise hosting demands local infrastructure'
potentially challenging for cloud-centric operations'
Platform exclusivity to Linux restricts adoption in heterogeneous OS environments'
Navigating Network Monitoring Solutions: The Nagios Approach
Nagios stands as a stalwart in the network monitoring landscape, offering two distinct versions to meet varying organizational needs. While the Core version provides open-source functionality at no cost, the XI edition delivers enhanced capabilities with professional support for enterprises willing to invest in more comprehensive solutions.
Known for its robustness and adaptability, Nagios has established itself as a dependable monitoring platform. However, users should be prepared for a somewhat steep configuration process that comes with its powerful customization options.
Notable Characteristics:
- Tiered Offering Structure: Users can choose between the free Core version or upgrade to the feature-enhanced XI commercial package.
- Plugin Architecture: The system's functionality can be expanded through numerous freely available plugins to create tailored monitoring environments.
- Network Traffic Visibility: Incorporates SNMP protocol support for monitoring network traffic patterns and usage.
The open-source Nagios Core lacks an integrated user interface, requiring implementation alongside visualization tools like Kibana to create a complete monitoring solution. In contrast, Nagios XI provides a comprehensive interface with real-time monitoring capabilities across the entire technology stack.
One significant limitation is that Nagios has strategically separated its traffic analysis functionality into a separate commercial product. This means neither Core nor XI includes native NetFlow capabilities, and the company has deliberately prevented the development of free NetFlow plugins that might compete with their premium offering.
Despite its configuration complexity, the free version benefits from strong community support. Both versions monitor infrastructure components and applications effectively, with Core offering essential notification methods (email/SMS), a simplified interface with network visualization, and basic reporting functionality.
Nagios Core does not include automatic device discovery, requiring users to manually configure and maintain complex setups. However, it offers extensive customization options, allowing users to tailor the system to their needs. The community has developed various plugins and add-ons that facilitate discovery processes and simplify initial configurations.
To evaluate Nagios, you can take advantage of a free 60-day trial of the commercial version. Once the trial concludes, if you choose to continue with the free edition, it’s advisable to back up your auto-generated configuration files located in /usr/local/nagios/etc. These backups can serve as a foundation for your subsequent installations, streamlining the setup process.
The paid edition, Nagios XI, enhances functionality with features like automatic device and host discovery, streamlined configuration workflows, and officially supported add-ons. Its user interface is more intuitive, and it offers advanced reporting capabilities, including trend analysis and capacity planning tools.
Nagios XI is primarily designed to operate on Red Hat Linux and CentOS platforms. For Windows environments, deployment through a virtual machine using Hyper-V or VMware is recommended. The enterprise version includes tools such as auto-discovery utilities and configuration wizards, simplifying the addition of new devices, hosts, or applications to your monitoring setup.
After deploying Nagios XI for ongoing surveillance,
its operations screen delivers an immediate, comprehensive snapshot of network health.
For granular analysis,
the operations center facilitates in-depth examination of individual components and detected events.
The host view provides granular visibility into each system's operational data.
Delve into any specific host for comprehensive metrics:
Performance trends visualized over time
Capacity forecasting projections
Active alert notifications
At the aggregation tier,
the dashboard compiles high-level health indicators
across all networked systems.
This two-tiered approach enables quick assessment
followed by targeted diagnostics when needed.
Monitoring service health is crucial, and a dedicated status page offers a clear overview of the operational state of essential services.
For small enterprises with limited budgets, Nagios Core presents an attractive option due to its free availability. However, deploying Nagios requires technical expertise, especially when integrating third-party front-end interfaces, as the core system does not include built-in traffic analysis features. Since Nagios is primarily designed for Linux environments, it can also be run on Windows through virtualization or containerization with Docker.
Cost-conscious organizations benefit from Nagios’s zero-cost entry point, making it accessible without upfront expenses. Its flexible pricing model is based on the volume of flow exports, supporting growth and scalability. The platform excels at delivering detailed reports and real-time alerts, aiding prompt issue resolution. Nonetheless, configuring Nagios can be complex, posing challenges for beginners, and its user interface may not be as intuitive as some modern alternatives.
When choosing between free and commercial solutions, organizations should assess whether they possess or can develop the necessary skills and resources to maximize Nagios Core’s capabilities or whether investing in paid, supported versions would be more efficient.
In contrast, tools like Kentik Detect adopt a SaaS approach, offering cloud scalability suited to expanding network infrastructures. As networks extend beyond physical premises, traffic data transforms into big data, making cloud-based analytics increasingly appealing.
Kentik’s platform consolidates diverse data streams—such as NetFlow, IPFIX, sFlow, SNMP, and BGP—into a unified view, facilitating comprehensive analysis. Its architecture includes a high-availability time-series data engine and an intuitive web interface, enabling easy access and integration with other systems. This approach is ideal for organizations seeking scalable, real-time network insights without the overhead of managing on-premises hardware.
NetFlow Analyzer Tools: What You Need to Know
Network monitoring is essential for maintaining optimal performance and security across your infrastructure. Modern NetFlow analyzers offer robust capabilities that extend beyond traditional monitoring approaches.
Cloud-Based Network Analysis Solutions
Today's leading network analysis platforms leverage cloud architecture to provide scalable monitoring capabilities. This approach eliminates the need for extensive on-premises hardware while offering flexible deployment options.
The advantage of cloud-based network monitoring includes simplified management, automatic updates, and the ability to scale resources according to your monitoring needs without significant infrastructure investments.
Protocol Compatibility in Modern Monitoring
Effective network monitoring solutions support multiple data collection protocols including:
- NetFlow (Cisco's network monitoring protocol)
- sFlow (sampling technology for high-speed networks)
- IPFIX (IP Flow Information Export standard)
- SNMP (Simple Network Management Protocol)
- BGP (Border Gateway Protocol)
This multi-protocol support ensures comprehensive visibility across diverse network environments and equipment vendors.
Advanced Analysis Capabilities
Modern platforms feature sophisticated data exploration tools that enable administrators to:
- Perform deep-dive traffic analysis
- Identify performance bottlenecks
- Monitor bandwidth consumption patterns
- Track application performance metrics
- Detect anomalous network behavior
Web-Based Management Interfaces
Today's solutions typically offer browser-based dashboards that provide:
- Customizable visualization options
- Real-time traffic monitoring
- Historical trend analysis
- Configurable alerting mechanisms
- Performance reporting capabilities
Security Integration Features
Leading NetFlow analyzers now incorporate security functions that can:
- Detect potential DDoS attacks
- Identify unusual traffic patterns
- Monitor for unauthorized access attempts
- Track botnet activity
- Provide threat intelligence integration
Unlock powerful network data interrogation capabilities
that transform massive datasets into actionable insights
Instantly filter and dissect billions of collected records
leveraging intuitive table formats and graphical visualizations
Conduct dynamic, on-the-fly analysis of your network traffic
revealing granular details through customizable data explorations
Setting up alerts to monitor network health involves designing policies that specify triggering conditions for alarms. These alerts can be communicated through various channels, including email notifications, Slack messages, pagers, and more, ensuring timely awareness of unusual network activity.
While Kentik offers comprehensive traffic analysis capabilities, it comes with a higher price point compared to other tools, making it less suitable for small businesses. Mid-sized companies should carefully evaluate whether Kentik's features justify its cost, especially when compared to alternative solutions in this review. On the other hand, large organizations managing multiple locations, utilizing cloud services, and hosting on-premises applications may find Kentik to be a valuable asset for their network monitoring needs.
Key features include:
- Clear and concise data visualization: It combines real-time data reporting with straightforward graphical displays, allowing for quick interpretation of NetFlow metrics.
- Easy-to-use filtering options: Intuitive filters enable rapid access to historical data, streamlining analysis.
- Extensive protocol support: Compatibility with various NetFlow protocols increases versatility across different network setups.
- Cloud-only deployment: As a SaaS-based service, it limits options for organizations seeking on-premises solutions.
- User interface challenges: The platform’s interface can be somewhat complex, which may hinder ease of use for some users.
If existing pre-built NetFlow analyzers don’t fully meet your requirements—either due to limited customization or insufficient power—you might consider building your own analytics tools. Several open-source and commercial packages are available for time-series data collection and analysis, many of which can be integrated with established tools like Plixer or ntopng. Whether you choose free or paid options, exploring these alternatives can provide tailored insights and greater control over your network data analysis.
Unveiling Powerful Network Traffic Analysis Solutions
In today's data-driven environment, organizations need robust tools to analyze network traffic. While NetFlow analyzers come in various forms, several comprehensive data platforms can be configured to process network flow data effectively.
Exploring the Splunk Ecosystem
Splunk stands out as a premium solution for data analysis across multiple domains. Though not exclusively designed for network monitoring, Splunk's versatility allows it to ingest NetFlow and IPFIX data through specialized add-ons.
The platform's strength lies in its customizability, enabling users to build tailored analysis dashboards. However, this flexibility comes with a significant learning curve. Organizations must invest time in configuration and development to fully leverage Splunk's capabilities for network traffic analysis.
Available in both on-premises (Splunk Enterprise) and cloud-based (Splunk Cloud) deployments, Splunk offers tremendous potential for cross-departmental analytics beyond just network monitoring. Technical professionals who master Splunk can extend their influence throughout their organization by creating diverse analytical applications.
The Elastic Stack Revolution
The Elastic Stack (formerly known as ELK) has emerged as a popular open-source alternative comprising Elasticsearch, Logstash, and Kibana. This modular approach allows teams to tackle implementation in manageable segments.
Logstash serves as the data collection engine with built-in NetFlow codec support. Elasticsearch provides powerful search and analytics capabilities, while Kibana delivers intuitive visualization options.
The Elastic Stack has gained significant traction in the industry, making it a valuable skill for career advancement. Its open-source nature offers cost advantages for organizations willing to self-host, while numerous third-party providers offer managed solutions with pre-built monitoring applications.
The stack's popularity has led to extensive community support, including implementation guides from major vendors like Cisco. Some implementations combine t